5.2. Topics Panel Pro
The Topics Panel is a panel in the left sidebar that gives you a topic-centered view of the DDS network. It lists every topic discovered across all active monitors in one place and lets you filter, inspect, and act on topics without having to navigate through the entity hierarchy.
5.2.1. Accessing the Topics Panel
The Topics Panel is opened from the vertical icon bar on the far left of the application window. The
bar contains five icons stacked top to bottom: the main entity explorer, the Topics Panel  ,
alerts, status, and issues. Click the icon to open the Topics Panel. It appears in the
left sidebar between the main entity monitoring panel and the alerts panel. Clicking the same icon again
while the sidebar is already showing the Topics Panel collapses the sidebar.
,
alerts, status, and issues. Click the icon to open the Topics Panel. It appears in the
left sidebar between the main entity monitoring panel and the alerts panel. Clicking the same icon again
while the sidebar is already showing the Topics Panel collapses the sidebar.
5.2.2. Panel Layout
The panel is organized into three areas from top to bottom.
Header bar
A fixed label reading TOPICS with a blue underline marks the panel. It is always visible at the top.
Filter bar
A text field with a  icon lets you filter the topic list by name. Typing any text hides topics
whose names do not contain that string. The filter is case-insensitive and applies instantly as you type.
Clearing the field restores the full list. When the filter is active and no topics match, the list shows
a No topics match filter notice. When no topics have been discovered at all, it shows No topics
discovered.
icon lets you filter the topic list by name. Typing any text hides topics
whose names do not contain that string. The filter is case-insensitive and applies instantly as you type.
Clearing the field restores the full list. When the filter is active and no topics match, the list shows
a No topics match filter notice. When no topics have been discovered at all, it shows No topics
discovered.
Topic list
The main scrollable area lists every discovered topic as a row. Each row shows the topic name on the left and the IDL type name in a smaller, muted font on the right. Both horizontal and vertical scrollbars appear when the content overflows the panel width.
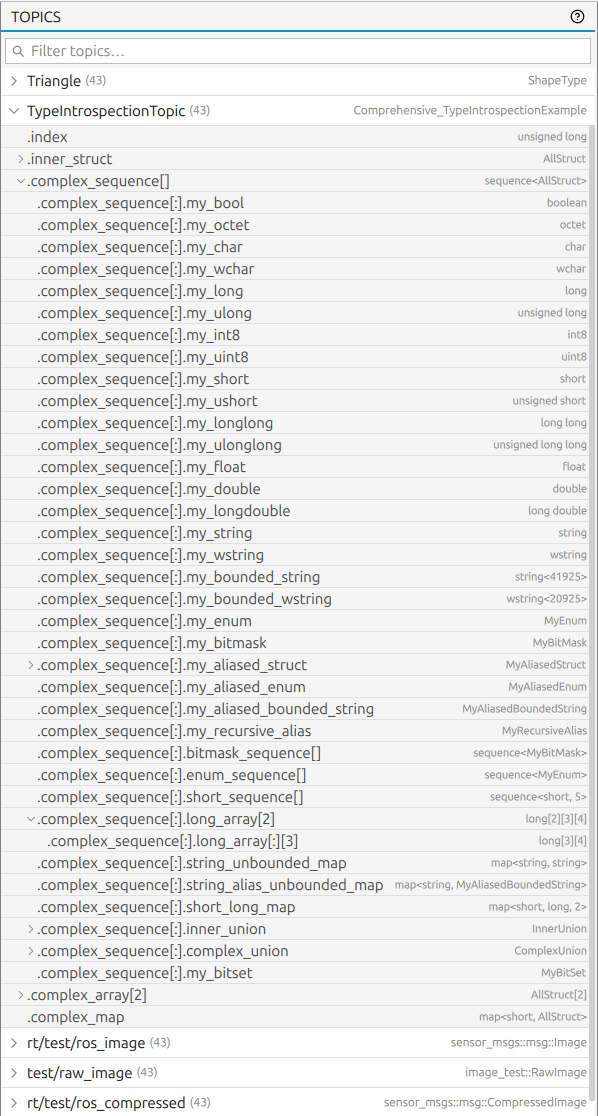
5.2.3. Expanding Topics
Clicking a topic row toggles it open or closed. A small arrow chevron on the left of each row indicates the current state, pointing right when collapsed and downward when expanded.
When a topic is expanded, the rows below it show the fields parsed from the topic’s IDL type definition. Each field row is indented according to its nesting depth. Struct fields that contain children show their own chevron and can be expanded further, up to a maximum of three nesting levels. Leaf fields show their field name on the left and the IDL type in a small muted label on the right.
5.2.4. Field Rows
Leaf fields that carry a numeric IDL type (integers, floats, and doubles) are interactive in two ways:
Drag to a Time Series Topic Chart by pressing and holding a numeric leaf field and dragging it onto an open Time Series Topic Chart pane. A drag badge appears under the cursor showing the field path while dragging. Dropping the field onto the chart adds it as a new series.
Right-click a numeric leaf field to open a small context menu with a Plot field action, which opens a new Time Series Topic Chart for that field directly.
Non-numeric struct or array fields can be expanded to reach their numeric children but cannot be dragged or plotted themselves.
5.2.6. Multiple Monitors
When more than one monitor is active (see Multiple Monitor Support ), the Topics Panel shows topics from all of them together. The domain identifier shown in the context menu and passed to any opened pane identifies which monitor the topic belongs to, so actions such as Spy or Chart always target the correct DDS environment even when the same topic name appears in more than one domain.