11.1. Time Series Topic Charts Pro
A Time Series Topic Chart plots the live values of one or more numeric fields from DDS topics over time. Each series tracks one numeric field from one DDS topic and updates in real time as samples arrive.
Fields that are integers, floats, or doubles can be plotted. Struct and array fields cannot be plotted directly but can be expanded to reach their numeric leaf fields.
11.1.1. Opening a Time Series Topic Chart
There are several ways to open a new Time Series Topic Chart pane:
Right-click a topic in the Topics Panel , the Logical Panel, or the domain graph and choose Chart topic data. Built-in and statistics Fast DDS topics cannot be charted and this option is disabled for them.
Use Add → Add Topic Live Chart in the application menu bar.
Click the Topic Charts View button in an empty pane; when the chart opens, select Time Series in the PLOT MODE row of the configuration panel.
Click the three-dots button in the header of any existing pane to open the split menu, then choose Split right or Split down and select Topic Chart to open a new chart alongside the current pane, or choose Replace panel to replace the current pane with a Time Series Topic Chart.
Drag a numeric field from an open Spy Pane and drop it onto an existing Time Series Chart. The field is added as a new series on that chart. Dropping it onto an empty area of the workspace creates a new chart with that field as its first series.
11.1.2. Managing Series
Adding a series:
Click + Add Series in the Series section to expand the series creation form. Select a topic from the filtered list and then pick a numeric leaf field. Fields only appear after the first DDS sample has arrived on that topic. Click Add Series to confirm, or double-click a field to add it immediately.
Drag a numeric field leaf from an open Spy Pane and drop it onto the chart. The field is added as a new series immediately.
Drag a numeric field leaf from the Topics Panel on the left sidebar and drop it onto an existing chart. The field must belong to a topic on the same domain as the chart.
Editing a series:
Right-clicking a series entry in the legend opens a context menu with the following options:
Rename series opens a dialog to give the series a custom display name shown in the legend.
Change color opens a color picker to assign a custom line color.
Hide series / Display series toggles the series visibility on the chart without removing it.
Set max data points sets how many recent data points this series retains in memory.
Remove series removes the series from the chart permanently.
The same options are available from the Series section of the Right-Side Pane Configuration sidebar, where each series has a row with a color swatch, rename, visibility toggle, and remove button.
Bulk actions:
The Actions section of the Right-Side Pane Configuration sidebar provides:
Show All Series makes every hidden series visible at once.
Hide All Series hides all series without removing them.
Clear Chart removes all series and resets the chart.
11.1.3. Chart Header Controls
The chart header provides the following buttons from left to right:
 Add Series opens the inline add-series panel in the Right-Side Pane Configuration sidebar.
 Reset View returns both axes to their default range after any manual zooming or panning.
 Toggle Legend shows or hides the legend listing all active series and their colors.
 /
/  Lock / Resume chart scroll locks both the X and Y axes so the chart stops
auto-scrolling while data keeps flowing in. The button shows while at least one axis is still
auto-scrolling and switches to once both are locked. Clicking it again unlocks both axes and
resumes auto-scroll. Data reception is unaffected; to pause ingestion use the Running toggle in the
sidebar.
Lock / Resume chart scroll locks both the X and Y axes so the chart stops
auto-scrolling while data keeps flowing in. The button shows while at least one axis is still
auto-scrolling and switches to once both are locked. Clicking it again unlocks both axes and
resumes auto-scroll. Data reception is unaffected; to pause ingestion use the Running toggle in the
sidebar. Help opens a contextual help panel with a description of the chart, usage tips, available
interactions, and a link to this documentation page.
Help opens a contextual help panel with a description of the chart, usage tips, available
interactions, and a link to this documentation page. /
/  - maximizes/ minimizes the pane; click again to restore the previous layout.
 Panel Settings opens the Right-Side Pane Configuration sidebar for this chart.
The three-dots button opens the split menu to open a new pane to the right or below the current one.
 Close closes the pane.
11.1.4. Interactive Chart Controls
The following mouse and keyboard interactions are available directly on the chart area:
Click on a data point to show its exact value.
Scroll wheel to zoom the X axis in and out.
Ctrl + scroll wheel to zoom the Y axis in and out.
Shift + drag to zoom into a selected area.
Ctrl + click and drag to scroll (pan) the axes without zooming.
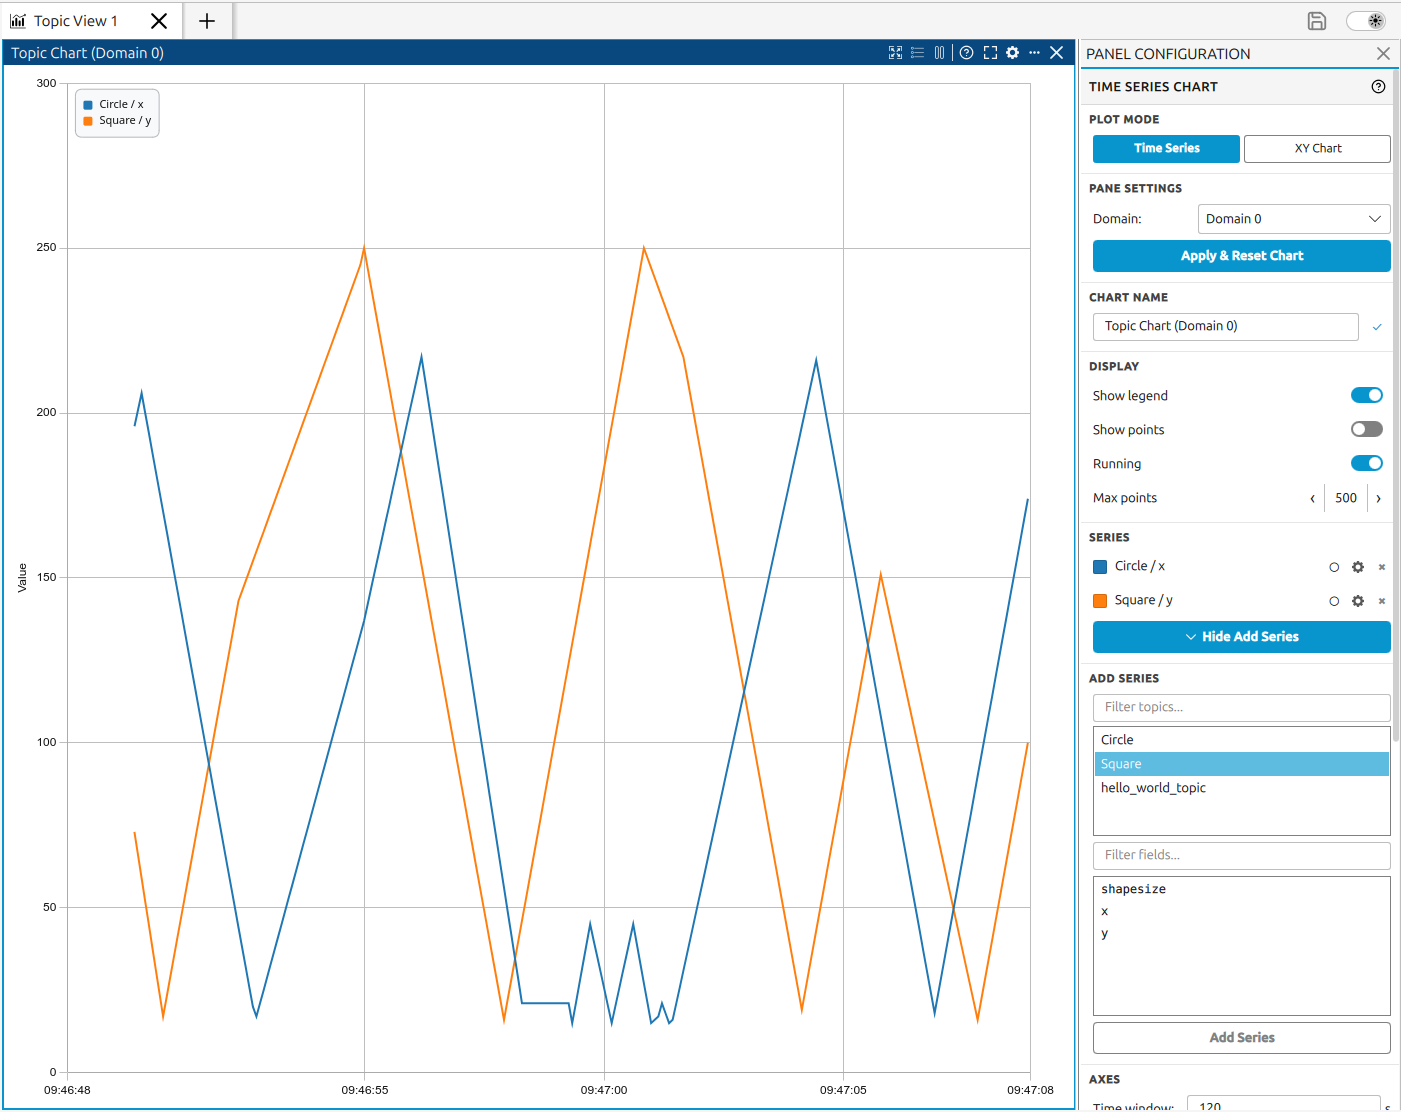
11.1.5. Right-Side Configuration Panel
Opening the Right-Side Pane Configuration sidebar for a Time Series Topic Chart (via the button)
shows the following sections:
Pane Settings - domain selection, time window, max points, applied with Apply & Reset Chart.
Chart Name - rename the chart title shown in the pane header.
Display - toggles for legend, data points, and running (pause/resume ingestion).
Series - list of active series with per-series controls; Add Series button to expand the inline series creation form.
Axes - lock Y axis or X axis to a fixed range; Reset Zoom.
Panel Actions - split and replace submenus, save and copy screenshot.
Actions - show/hide all series, clear chart.
See Right-Side Pane Configuration for the full configuration panel reference.