14. Right-Side Pane Configuration Pro
The Right-Side Pane Configuration panel is a sidebar that slides in from the right edge of the
workspace.
For chart, spy, IDL, image, and publisher panes it provides inline configuration: you can create new
panes and edit the settings of existing ones without opening a separate dialog.
When a Domain Graph tab is active, clicking the  button opens the same sidebar with a dedicated
visibility control panel for managing which entities are displayed in the graph
(see Domain Graph).
button opens the same sidebar with a dedicated
visibility control panel for managing which entities are displayed in the graph
(see Domain Graph).
14.1. Opening the Panel
There are several ways to open the configuration panel:
Click the
button in the header of any existing pane to open the panel configured for that pane.Click an empty pane placeholder to enter the pane creation flow for that slot.
The panel can also be opened programmatically when you use context menu actions that target it, such as opening a new pane from the split menu on any pane header.
To close the panel, click the ✕ button in its header.
14.2. Panel Layout
The panel has a fixed header at the top that is always visible when a pane is selected or a creation flow is active.
Header bar
Shows the label PANEL CONFIGURATION and a close button on the right.
Below the header, the content area shows the configuration form specific to the open pane type and its current mode.
14.3. Creation vs. Configuration Mode
The panel operates in one of two modes depending on how it was opened.
In creation mode, the panel shows a wizard-style form for a pane type that does not yet exist. You select the domain, topic, and other required parameters, then confirm to create the pane. Creation forms include a cancel button that discards the flow without affecting the workspace layout.
In configuration mode, the panel shows the live settings for an already-open pane. Changes take effect through explicit action buttons such as Apply & Restart or Apply & Reload rather than automatically, so you can adjust multiple fields before committing.
14.4. Configuration by Pane Type
Each pane type exposes a different set of sections in the configuration panel. The sections specific to each type are documented in detail on the corresponding pane pages. The following is a summary with references.
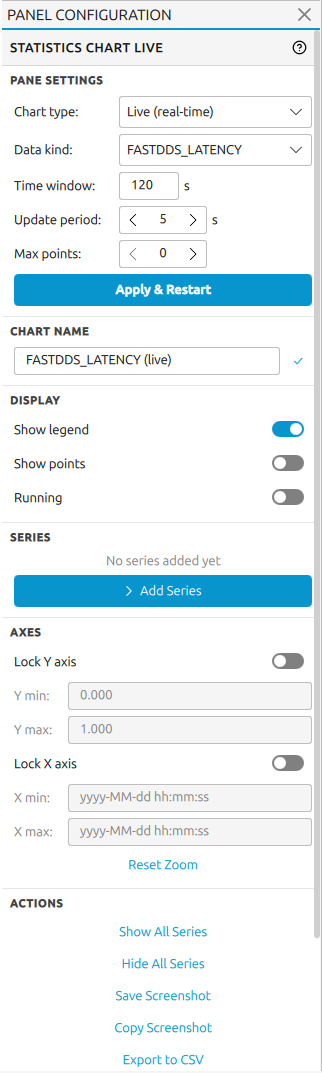
14.4.1. Statistics Chart
See Statistics Charts for the full statistics chart documentation.
The configuration panel for a statistics chart covers:
Chart name editing.
Data kind, time window, update period, and maximum data points, applied together with Apply & Reset Chart.
Series list with per-series controls for label, color, visibility, max data points, and removal.
An inline add-series form with entity and statistics kind selection.
X-axis and Y-axis locking with explicit minimum and maximum.
Display toggles for the legend and data points.
Pause/resume toggle.
Actions with replace-split submenus, show and hide and screenshot options.
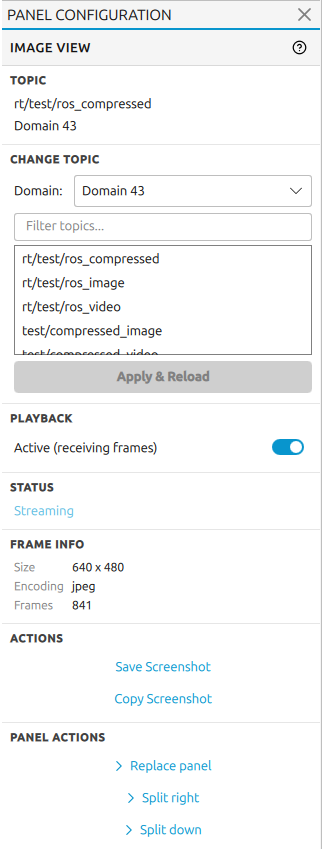
14.4.2. Image Pane
See Image Pane for the full image pane documentation.
The configuration panel for an image pane covers:
A read-only Topic section showing the current topic name and domain.
A Change Topic section listing only image-compatible topics, with an Apply & Reload button.
A Playback toggle to start or stop the frame stream.
A read-only Status indicator (Streaming, Waiting for frames, Paused, or Error).
A Last Error section visible only when a decode error has occurred.
A Frame Info section showing resolution, encoding, and frame count once frames arrive.
Actions with split submenus and screenshot options.
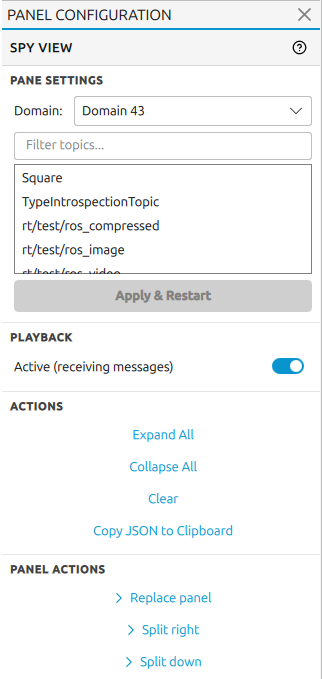
14.4.3. Spy Pane
See Spy Topic View for the full spy pane documentation.
The configuration panel for a spy pane covers:
Domain and topic selection with Apply & Restart to switch the subscription.
Playback toggle to start or stop the live data feed.
Actions with replace-split submenus, show and hide and screenshot options.
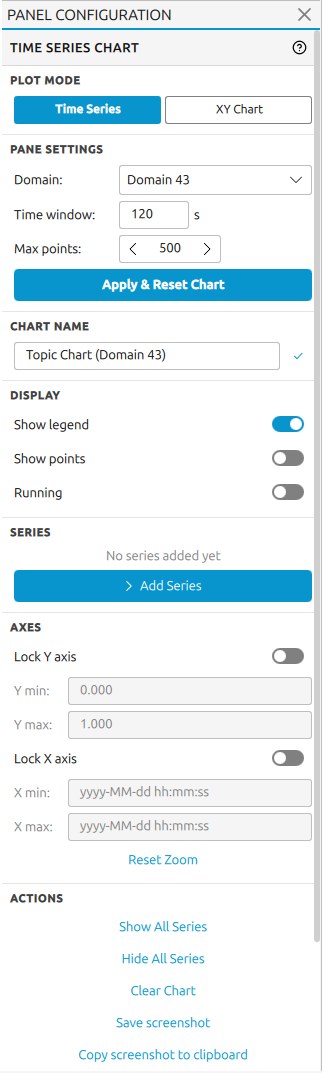
14.4.4. Time Series Topic Chart
See Topic Charts for the full topic chart documentation.
The configuration panel for a topic chart covers:
Chart name editing.
Domain, time window, and maximum data points, applied together with Apply & Reset Chart.
Series list with per-series controls for label, color, visibility, max data points, and removal.
An inline add-series form with topic and numeric field selection. Click + Add Series to expand it. Select a topic, wait for the first sample to arrive so fields are populated, then pick a field and confirm with Add Series or double-click the field.
Y-axis locking with explicit minimum and maximum.
Display toggles for the legend, data points, and the sliding window mode.
Actions with replace-split submenus, show and hide and screenshot options.
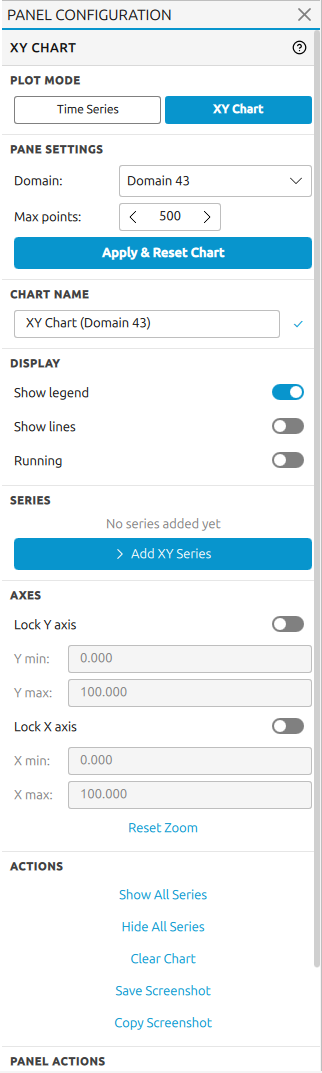
14.4.5. XY Topic Charts
See XY Charts for the full XY charts documentation.
The configuration panel for XY charts covers:
Chart name editing.
Domain, time window, and maximum data points, applied together with Apply & Reset Chart.
Series list with per-series controls for label, color, visibility, max data points, and removal.
An inline add-series form for selecting an X topic and field and a Y topic and field independently. Click + Add XY Series to expand it. X and Y values may come from the same or different topics.
X-axis and Y-axis locking with explicit minimum and maximum.
Display toggles for the legend, connecting lines, and the running (pause/resume) mode.
Actions with replace-split submenus, show and hide and screenshot options.
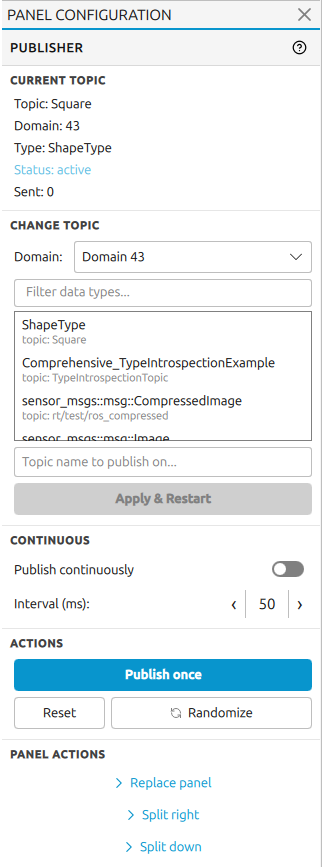
14.4.6. Publisher Pane
See Publisher Pane for the full publisher pane documentation.
The configuration panel for a publisher pane covers:
A read-only Current Topic section showing the topic name, domain, resolved type name, publisher status, and number of samples sent.
A Change Topic section with domain and topic selection and an Apply & Restart button that rebuilds the dynamic-type form for the new topic.
A Continuous section with a Publish continuously toggle and an Interval spin box in milliseconds (minimum 50 ms).
An Actions section with Publish once, Reset, and Randomize buttons.
Panel Actions with replace-split submenus.
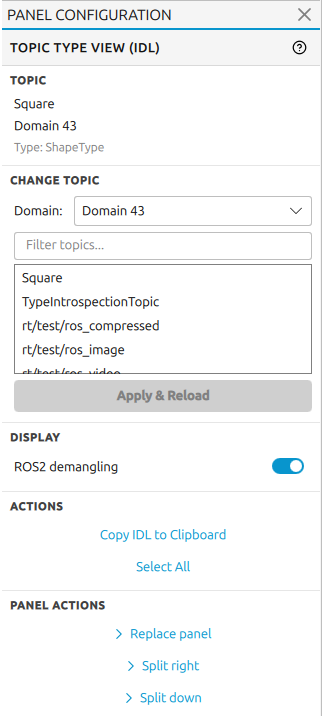
14.4.7. IDL Pane
See Topic Type View (IDL) for the full IDL pane documentation.
The configuration panel for an IDL pane covers:
A read-only Topic section showing the current topic name, domain, and resolved type name.
A Change Topic section with domain and topic selection and an Apply & Reload button.
A Display toggle for ROS 2 demangling.
Actions with replace-split submenus and copying option.
14.5. Domain Graph
When a Domain Graph tab is active, click the button to open the right-side panel.
It shows a dedicated visibility control panel instead of the pane-type configuration described above.
Changes take effect immediately as checkboxes are toggled; there is no apply step.
See Domain View for the full Domain View documentation.
The panel lists all entities discovered in the domain, grouped into seven collapsible sections: Topics, Hosts, Users, Processes, Participants, DataWriters, and DataReaders. Each section shows the alias of every discovered entity of that kind alongside a checkbox and a visible/total count in the section header.
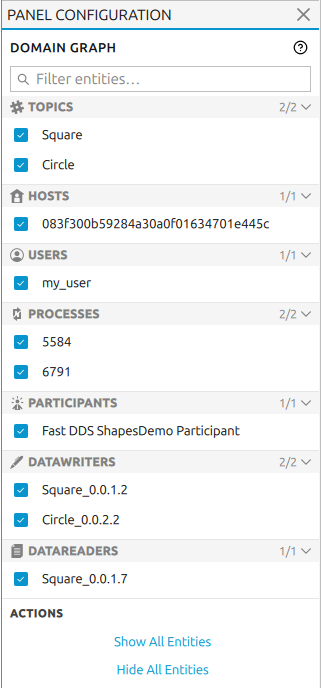
The panel covers:
A search field at the top that filters all sections simultaneously. Sections with no matching aliases collapse automatically while the filter is active.
Per-entity checkboxes to show or hide individual entities by alias. Unchecked entities are removed from the graph but remain listed so they can be restored at any time.
Note
Visibility is controlled by alias, not by internal entity identifier. If two or more entities of the same kind share the same alias, toggling that entry hides or shows all entities that carry that alias simultaneously.
Collapsible sections that can be expanded or collapsed by clicking the section header.
An Actions section with two bulk buttons:
Show All Entities - makes every entity of every kind visible.
Hide All Entities - hides every entity of every kind at once.
When all entities of a given kind are hidden and a new entity of that same kind is subsequently discovered - for example after enabling metatraffic visibility or after a new participant joins - the new entity inherits the hidden state automatically. If at least one entity of that kind is visible, newly discovered ones appear visible by default. Manual checkbox selections are preserved across model refreshes and are never overridden by this rule.
When a Domain Graph tab has been filtered to a specific topic (by right-clicking a topic node in the graph and selecting the filter action), the panel lists only the entities actually connected to that topic: the filtered topic itself, the DataWriters and DataReaders publishing or subscribing to it, and their parent Participants, Processes, Users, and Hosts. Entities not involved in the filtered view are omitted from the panel entirely, since they are not part of that graph.