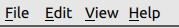
2. Layout
This section explains the Graphical User Interface (GUI) of the Fast DDS Monitor application. It will briefly explain the main menus and windows that could be seen, in order to familiarize the user with where to find the buttons and information. Below is a screenshot of the Fast DDS Monitor application in operation.

2.1. Application Menu
This general menu contains all the options available for this application divided in four groups depending on their area of operation:
File: General propose buttons.
Edit: Specific buttons with application functionality
View: Window layout configuration.
Help: Useful links for getting application information or support.
For the explanation of the functionality of this buttons refer to the section Application Menu.
2.2. Shortcuts Bar
This horizontal bar contains shortcuts to the main operations supported by the application, so the user has a faster access to the main functionalities. This bar could be configured in the View tab of the application menu.

For the explanation of how to configure this bar refer to the section Shortcuts Bar.
2.3. Explorer Panel
This panel shows the different entities that have been discovered by the monitor. They will be displayed in interactive lists that the user could expand or collapse. These entities are clickable as well, in order to inspect their information shown in this same panel.
This panel contains a mutable number of subpanels. The different panels that could be shown are the DDS Panel, the Physical Panel, the Logical Panel and the Entity Info Panel. In these subpanels, the entities discovered are going to be displayed depending on their kind. In order to know which kind of entities the application has and how are they divided in categories, please refer to Entities.
To add a new panel to display other relevant information, use the ... button in the upper bar of the panel and
select those subpanels that want to be show or hide.
To increase or decrease this sidebar size, grab the border of it and move it to the desired size.
In order to hide the whole left sidebar, click Hide Left sidebar in the View menu.
For more information about what is an entity and how they are organized refer to Entities. For more information about what it means to select an entity refer to Selected Entity.
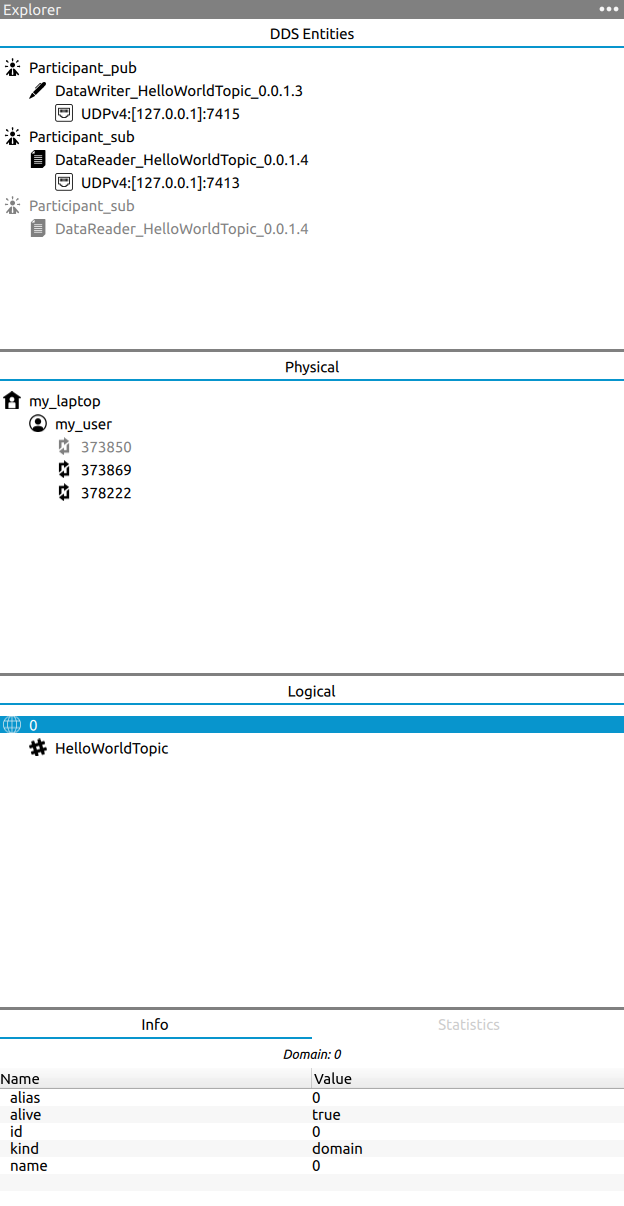
2.3.1. DDS Panel
This subpanel shows the DDS Entities of the monitor. These entities are the DDS DomainParticipant, the DDS DataReader and DataWriter, and the transport Locators that each entity is using. This subpanel will be filled with the DDS entities that are related with the entity currently selected, so it could happen that not all DDS entities discovered by the monitor appear in this subpanel at a certain point (see Selected Entity for further details).
For the explanation of this entities and the interaction with them refer to the section DDS Panel.
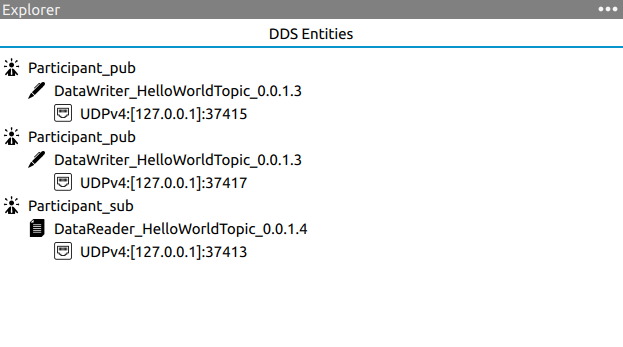
2.3.2. Physical Panel
This subpanel shows the Entities discovered by the monitor that refer to physical entities. There are three different kind of physical entities, Host, User and Process. These entities refer to the main information of the machine and the context where an application using Fast DDS is running. For further explanation of these entities and the interaction with them refer to the section Physical Panel.
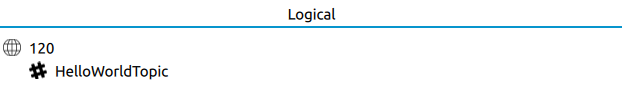
2.3.3. Logical Panel
This subpanel shows the Entities discovered by the monitor that refer to abstract entities in a DDS communication network. These entities are Domain and Topic. These entities refer to abstract partitions in a DDS network. Only entities in the same Domain could communicate to each other by publishing or subscribing in the same Topic. For further explanation of this entities and the interaction with them refer to the section Logical Panel.
2.3.4. Entity Info Panel
This subpanel displays information regarding the last entity clicked.
This information is divided in two categories, which are shown in the different subpanel tabs.
First, the info tab contains the general information of the last entity clicked.
Secondly, the Statistics tab contains a summary of the main statistical data regarding the last entity clicked.
2.3.4.1. Info Panel
This panel shows the main information of the last entity clicked. This information differs depending on the kind of the entity, i.e. for a DDS Entity, the QoS information would be shown, while for a Process, its process id will be displayed.

For the explanation of this information refer to the section Info Panel.
2.3.4.2. Statistics Panel
This panel shows a summary of the main statistical data related with the last entity clicked.
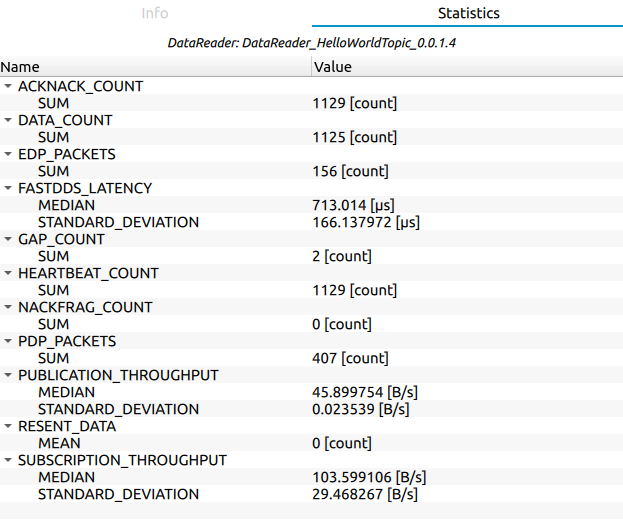
For the explanation of this information refer to the section Statistics Panel.
2.4. Alerts Panel
This panel shows the different alerts created by the user to monitor specific events in the DDS network.
For the explanation of this information refer to the section Alerts Panel.
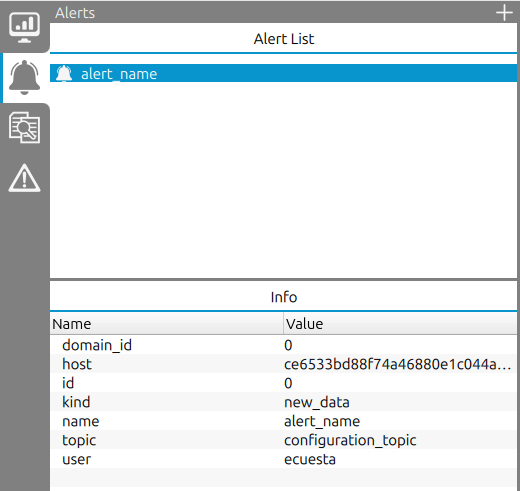
2.4.1. Alert List
This panel lists the alerts created by the user to monitor specific events in the DDS network.
These alerts are created by clicking on the  button in the Shortcuts Bar or in the
+ symbol in the upper right corner of the panel.
Once created, the alerts will be listed in this panel, and the user can remove them by right clicking
on the alert and selecting the remove option.
button in the Shortcuts Bar or in the
+ symbol in the upper right corner of the panel.
Once created, the alerts will be listed in this panel, and the user can remove them by right clicking
on the alert and selecting the remove option.
2.4.2. Alert Data
This panel shows the configuration values of the alert selected in the Alert List, including the alert name, its domain, the values of host, user and topic of the monitored entities, its threshold or the duration of the alert.
2.5. Monitor Status Panel
In this panel, different data related to the entities being monitored or the current state of the application will be displayed. This panel contains two different subpanels, the Status Panel and the Log Panel. To change from one another, press on the name of the subpanel to be displayed.
To increase or decrease this sidebar size, grab the border of it and move it to the desired size. In order to hide the whole left sidebar, click Hide Left sidebar in the View menu.
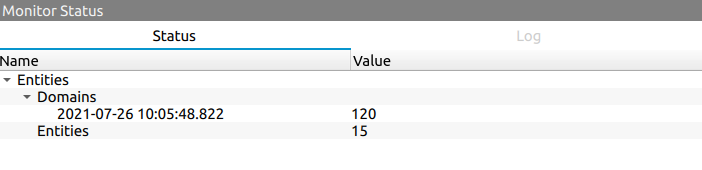
2.5.1. Status Panel
This panel shows a collection of data related with the current state of the application:
Entities refer to the number of entities being monitored in the user application.
Domains is a collection of the Domains that have been initialized in the Monitor.
For a thorough explanation of this information refer to the section Status Panel.
2.5.2. Log Panel
This panel shows the callbacks that the application has obtained. These callbacks refer to different events in the DDS network that is being monitored. These callbacks could be cleared by using the Refresh. A callback may refer to:
The discovery of a new Entity in the DDS network.
The reception of new data related to any of the entities that are being monitored.
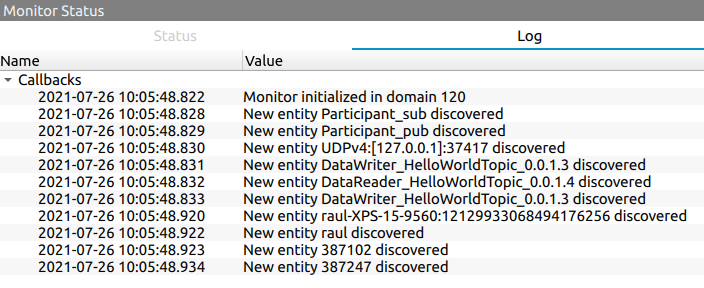
For a thorough explanation of this information refer to the section Log SubPanel.
2.6. Issues Panel
This panel lists the error events of the application. The events that the application reacts to in the current version are:
Attempt to start monitoring a DDS Domain or a Discovery Server network that has been previously initialized.
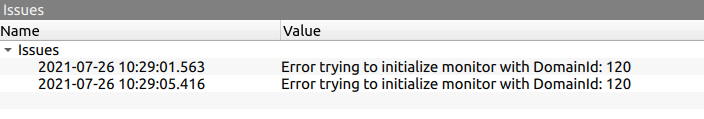
For a thorough explanation of this information refer to the section Issues Panel.
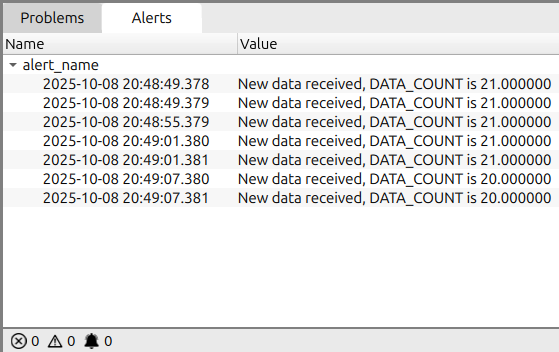
2.7. Alert Messages Panel
This panel lists the alert events that the application has detected based on the alerts created by the user. These alerts are shown in a tree structure, where the most recent alerts are shown at the bottom.
2.8. Main Panel
The central window allows multiple tabs for different views. It also displays a collapsed menu with the possible problems that have been detected on the DDS entities. It can display the data charts, so-called Chartbox, that the user has configured. It can also display a domain graph where the physical, logical and DDS entities from a domain are represented, focusing on the connection between endpoints through the topics, and the entities physical inheritance.
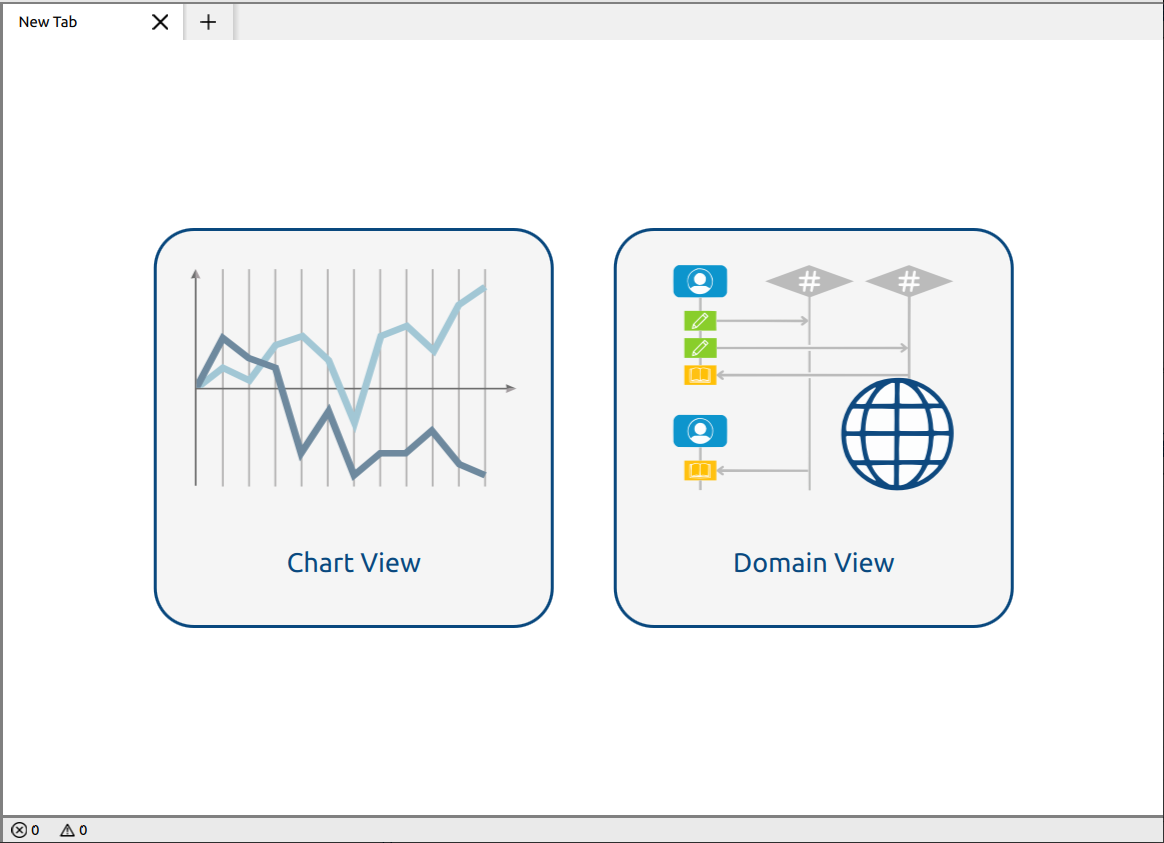
For further information about how to create a chart refer to the section Charts Panel.
2.8.1. Chartbox
These windows in the main panel store some series or data configurations to show a specific data type for one or several entities in a specified time interval and with different accumulative operations on the data.
To create a new Chartbox go to Chart View in the Main Panel default tab, and click on Create new chart button. This button will create a new Chartbox where new series could be added, removed or modified.
These Chartboxes can be moved along the Chart View tab. In order to move one of these charts, click on the Chartbox title and grab the object to its new desired location inside the main panel. The rest of the Chartboxes will automatically rearrange when one of them is moved to a different position.

For further information about how to create a chart refer to the section Charts Panel.
2.8.1.1. Create Series Dialog
This Dialog will appear every time a new Chartbox is created, or adding a new series by the button in the Chartbox Series->AddSeries.

Fig. 2.1 Create historical series dialog

Fig. 2.2 Create real-time series dialog
For further details on how to configure a new series refer to Historic Data for historic data or Real-Time Data for dynamic data.
2.8.2. Domain View
This view in the main panel shows the connections between DataWriters and DataReaders that belong to the same DDS Domain. They are represented encapsulated inside their physical entities (see Entities relationship), and with a connection to the topic they publish on or are subscribed to, respectively.

By clicking on any entity, its detailed information is displayed in the Info Panel. Right click allows changing the alias of the entity, filter the problems to display only the selected entity’s problems and, in the case of topics, filtering the domain graph by topic so that only the entities related to the selected topic are displayed.
The right-side configuration panel Pro provides per-entity visibility controls for the graph. Individual topics, hosts, users, processes, participants, writers, and readers can be shown or hidden by alias, with bulk Show All and Hide All actions. See Domain Graph for details.
2.8.3. Problem summary
This section that can be expanded and collapsed displays all the collected problems per entity. Those problems are related to DataReader samples lost, incompatible QoS between endpoints, or DataWriter deadline missed counter, for instance.
The entities that have reported a problem would display a warning or an error icon close to the entity name, based on the severity of the problem. The entity representation in the domain graph may also display that icon.
