7. Statistics Charts
A Statistics Chartbox plots pre-computed DDS metrics (such as latency, throughput, and packet counts) collected from the monitored DDS network. Where Topic Charts work with raw values published on user-defined topics, Statistics Charts show the statistical summaries computed by the Fast DDS statistics module.
Two chart modes are available:
Historical - displays data over a user-specified past time range, using a fixed time window and an aggregation operation (mean, median, standard deviation, etc.).
Real-time - updates continuously as new statistical samples arrive, scrolling the time axis forward as the session progresses.
Multiple series from different entities can be overlaid on the same chart.
7.1. Opening a Statistics Chart
To create a new Statistics Chartbox:
Use Add → Add Statistics Chart in the application menu.
Click the
 button for a historical chart or
  for a real-time
chart in the shortcuts bar.
for a real-time
chart in the shortcuts bar.Click the Statistics Charts View button shown in an empty pane placeholder or in the main panel selector when no panes are open yet.
Click the three-dots button in any pane header, choose Split right or Split down, and select Statistics Chart from the pane-type menu, or choose Replace panel to replace the current pane with a Statistics Chart.
7.2. Series Management
Adding a series:
Click Series → Add Series in the Chartbox toolbar to open the series creation dialog. Each series tracks one data kind for one or more entities over the configured time window.
Editing a series:
Right-clicking a series name in the legend opens a context menu with the following options:
Rename series - assign a custom display name.
Change color - open a color picker to assign a custom line color.
Hide series / Show series - toggle visibility without removing the series.
Set max data points - limit how many data points this series retains in memory.
Remove series - permanently delete the series from the chart.
Export to CSV - export only this series to a CSV file.
Bulk actions:
Series → Hide All Series - hide every series at once.
Series → Display All Series - reveal all hidden series.
Chart → Clear chart - remove all series and reset the chart.
7.3. Chart Header Controls
The Chartbox toolbar provides the following actions from left to right:
 Reset Zoom - returns both axes to their default range, fitting all visible data.
Also accessible from Chart → Reset Zoom.
Reset Zoom - returns both axes to their default range, fitting all visible data.
Also accessible from Chart → Reset Zoom. Set Axes - opens a dialog to lock the Y axis to a fixed range.
For real-time charts, changing the X (time) axis is disabled by default so the chart keeps
scrolling while the Y axis stays fixed.
Also accessible from Chart → Set axes.
Set Axes - opens a dialog to lock the Y axis to a fixed range.
For real-time charts, changing the X (time) axis is disabled by default so the chart keeps
scrolling while the Y axis stays fixed.
Also accessible from Chart → Set axes. /
/  Pause / Resume (real-time charts only) - freezes or resumes the time-axis
scroll.
While paused, data continues to be received but the view stays fixed, allowing zooming and
panning over historical data.
Pause / Resume (real-time charts only) - freezes or resumes the time-axis
scroll.
While paused, data continues to be received but the view stays fixed, allowing zooming and
panning over historical data. Chart Controls - opens a contextual help panel with usage tips and a link to this
documentation page.
Chart Controls - opens a contextual help panel with usage tips and a link to this
documentation page. /
/  - maximizes/ minimizes the pane; click again to restore the previous
layout.
- maximizes/ minimizes the pane; click again to restore the previous
layout. Panel Settings - opens the Statistics Chart sidebar for this chart.
The three-dots button opens the split menu to open a new pane to the right or below, replace the current pane, or close it.
 Close - removes the chart from the workspace.
7.4. Interactive Chart Controls
The following mouse and keyboard interactions are available directly on the chart area:
Click a data point to display an info box showing its exact timestamp and value.
Ctrl + scroll wheel to zoom in or out on the chart center.
Ctrl + click and drag to scroll (pan) the view without zooming.
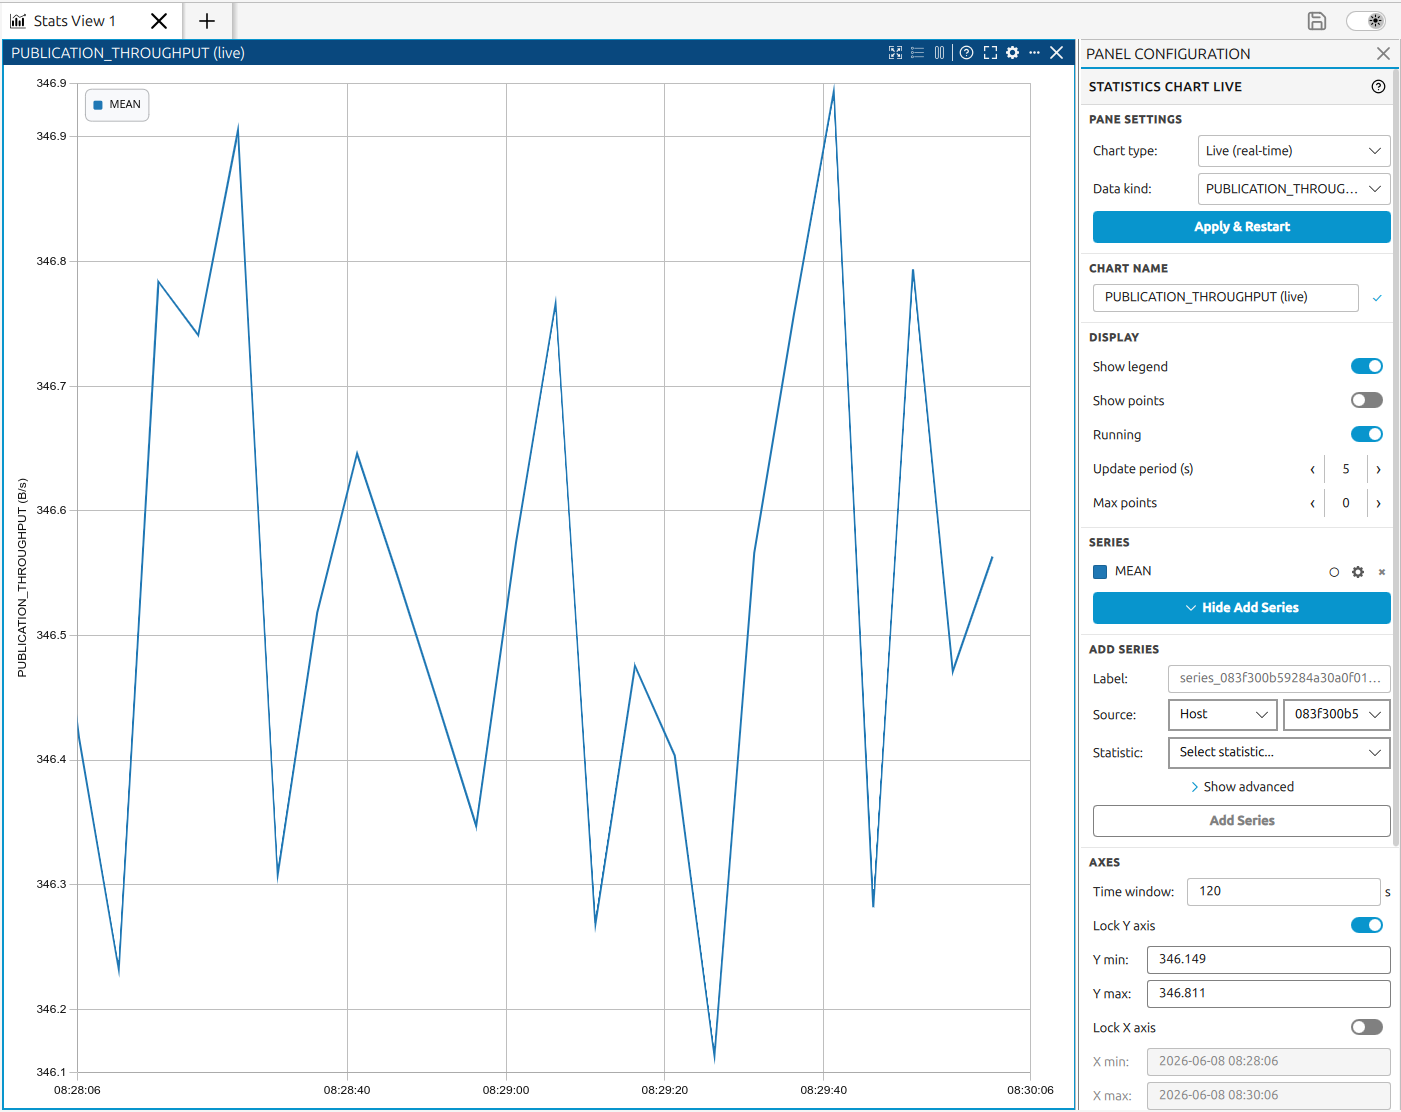
7.5. Right-Side Configuration Panel Pro
When the Statistics Chart sidebar is open for a Statistics Chart (via the button)
it shows the following sections:
Pane Settings (creation mode) - configure the chart before adding series:
Chart type - choose Historical (fixed past time range) or Live (real-time).
Data kind - select the DDS statistic to plot (e.g.
FASTDDS_LATENCY).Click Apply & Restart to apply the settings and prepare the chart for series.
Chart Name - rename the chart title shown in the pane header.
Display - toggles for legend, data points, and running (pause/resume ingestion).
Series - list of active series with per-series controls; Add Series button to expand the inline form for selecting source entity, target entity, and statistics kind.
Axes - lock Y axis or X axis to a fixed range; Reset Zoom.
Actions - show/hide all series, export to CSV, save and copy screenshot.
Panel Actions - split and replace submenus.
See Right-Side Pane Configuration for the full configuration panel reference.