8. Domain View
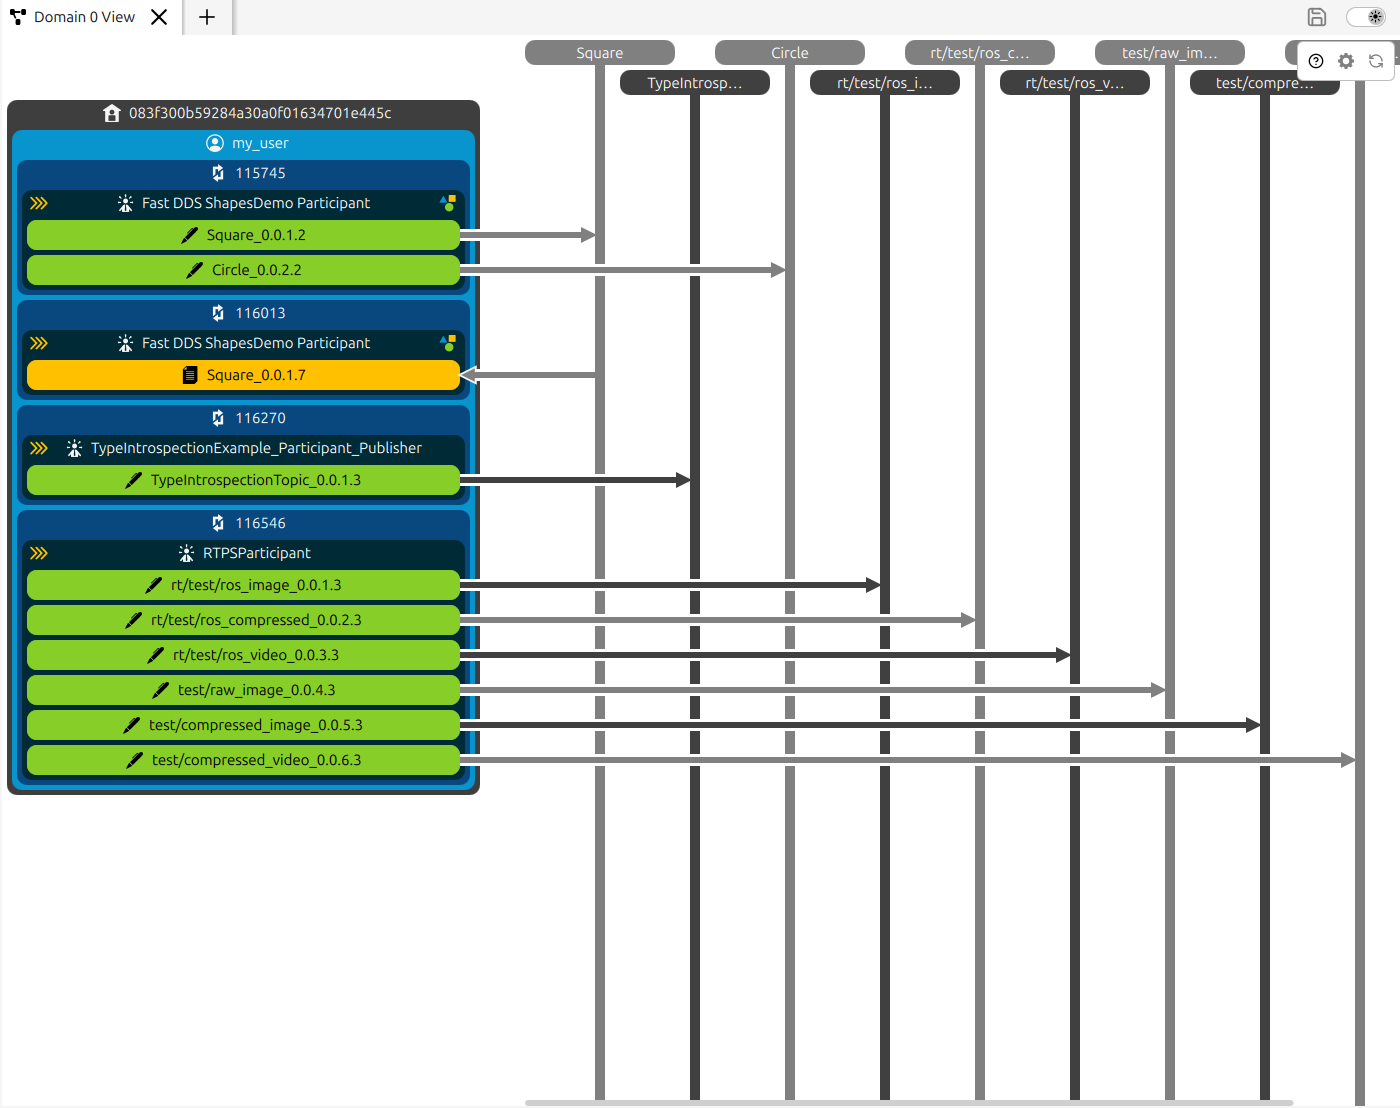
The Domain View shows all entities belonging to the same DDS domain as an interactive graph. Entities are displayed encapsulated inside their physical context, with arrows indicating the publisher-subscriber relationships through their shared topics. Arrows run from a DataWriter to its topic, and from a topic to its DataReaders.
8.1. Entities
Clicking any entity in the graph selects it; its details appear in the Entity Info Panel in the Explorer Panel.
Right-clicking an entity opens a context menu with the following actions:
Change alias - opens a dialog to assign a custom display name to the entity. The alias is used throughout the application.
View problems - filters the Problem Summary panel to show only issues related to this entity.
8.2. Topics
Topics appear as vertical lines in the graph, with DataWriters feeding into them and DataReaders consuming from them.
Right-clicking a topic opens a context menu with additional actions besides the possibility to change alias and to view problems:
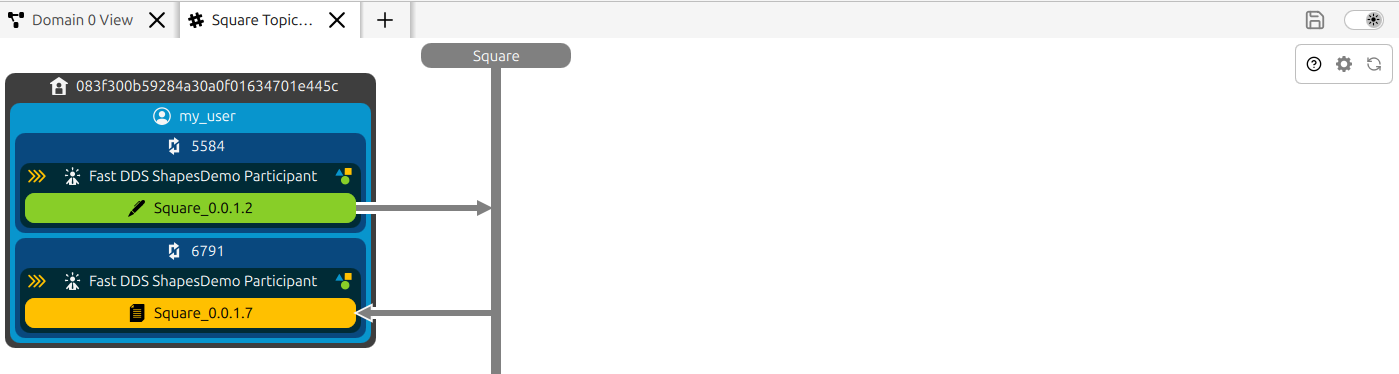
Filter topic graph - opens a filtered view showing only the entities whose endpoints publish to or subscribe from this topic. The filtered graph opens in a new tab.
Data type IDL view - opens a Topic Type View (IDL) showing the full IDL type definition for the topic. For ROS 2 topics the IDL is shown demangled by default; see ROS 2 Demangling for details.
Set alert - opens a dialog to create a new alert for this topic.
Spy topic data - opens a Spy Topic View for this topic.
Publish topic data - opens a Publisher Pane for this topic.
Chart topic data - opens a Time Series Topic Charts chart for this topic.
8.3. Metatraffic
Metatraffic entities - Fast DDS statistics topics, ROS discovery topics, and their associated endpoints - are hidden from the graph by default. When hidden, they are completely excluded from the domain view and entity lists.
To show metatraffic in the graph, go to View -> Hide/Show Metatraffic. When visible, metatraffic topics and their endpoints appear in the domain graph like any other entity and can be interacted with in the same way.
8.4. Visibility Pro
Individual entities can be shown or hidden from the graph without removing them from the monitor. This is controlled through the right-side configuration panel for the Domain View.
Click the  button in the Domain View tab header to open the configuration panel.
Each entity type (Topics, Hosts, Users, Processes, Participants, DataWriters, DataReaders) is
listed in its own collapsible section with a checkbox per entity alias.
Clear a checkbox to hide that entity; the entity remains listed and can be restored at any time.
Hiding a container entity (such as a Host or Process) also hides all its descendants - child
entities cannot remain visible as orphan nodes in the graph.
button in the Domain View tab header to open the configuration panel.
Each entity type (Topics, Hosts, Users, Processes, Participants, DataWriters, DataReaders) is
listed in its own collapsible section with a checkbox per entity alias.
Clear a checkbox to hide that entity; the entity remains listed and can be restored at any time.
Hiding a container entity (such as a Host or Process) also hides all its descendants - child
entities cannot remain visible as orphan nodes in the graph.
See Domain Graph for the full description of the visibility control panel.
8.5. Routed Domains and Proxy Entities
When multiple monitors are active (see Multiple Monitor Support ), each monitor tab shows its own independent domain graph. Entities from one domain are not shown in another domain’s graph unless they are explicitly bridged or proxied.
Proxy entities are entities from other domains whose statistics messages are reaching the current monitor’s domain. This happens, for example, when a Fast DDS Router is routing traffic from a different DDS domain into the monitored domain: the remote entities appear as proxy entities in the graph of the local domain. Proxy entities can optionally be displayed. Go to View -> Hide/Show Proxy Entities to toggle their visibility. When visible, proxy entities appear in the graph and entity lists and their data can be charted.