5.4. Status Panel
The status panel in the left sidebar displays data about the monitored entities and the current state of the application. It contains two sub-panels: Status Sub-Panel and Log Sub-Panel. Click the sub-panel name to switch between them.
Drag the panel border to resize it. To hide the panel, use View → Hide Left Sidebar.
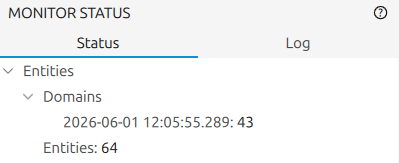
5.4.1. Status Sub-Panel
Displays a brief summary of the current state of Fast DDS Monitor Pro:
Entities: the total number of entities currently being tracked.
Domains: the list of domains initialized in the monitor so far.
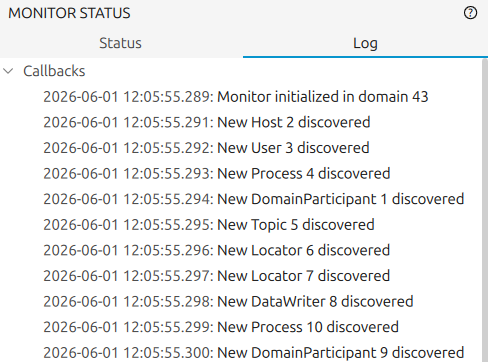
5.4.2. Log Sub-Panel
Displays the events received by the application as callbacks. Callbacks are triggered when new entities are discovered, when previously known entities change state, or when any other event occurs in the monitored DDS network. Each callback entry shows the affected entities and the time of the event.