5.3. Alerts Panel
The alerts panel is located on the left side of the application window and allows the user to define conditions to monitor and receive notifications about specific events in the DDS network. It consists of two sections:
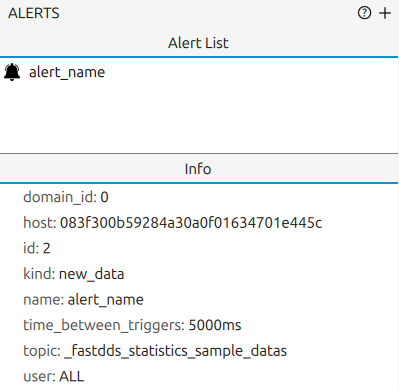
5.3.1. Alerts List
Displays the list of alerts defined by the user.
Alerts are created using the  button in the Shortcuts Bar or the + button in the
upper-right corner of the panel.
Selecting an alert highlights it and shows its details in the Alert Info.
Right-click an alert to remove it.
button in the Shortcuts Bar or the + button in the
upper-right corner of the panel.
Selecting an alert highlights it and shows its details in the Alert Info.
Right-click an alert to remove it.
5.3.2. Alert Info
Displays the configuration of the alert currently selected in the Alerts List, including its domain, host, id, kind, name, time between triggers, topic, and user.
For alert event notifications, see Alert Messages Panel.
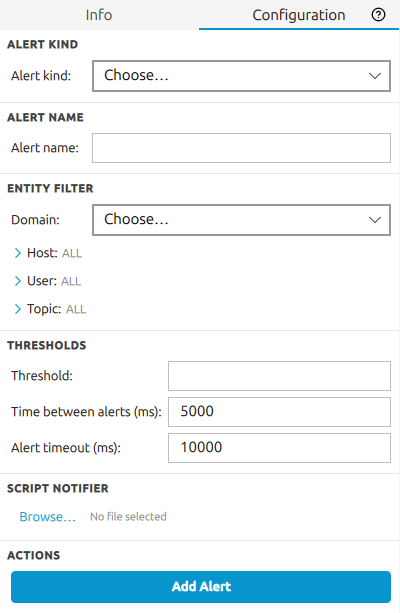
5.3.3. Alert Configuration
The Configuration tab in the lower section of the Alerts Panel provides an integrated form for creating and editing alert rules without opening a separate dialog.
The  button is available at the right side of the Configuration tab header.
Clicking it opens a contextual popover with a short description of the pane and tips.
button is available at the right side of the Configuration tab header.
Clicking it opens a contextual popover with a short description of the pane and tips.
The form contains the following fields:
Alert kind - selects the DDS metric to monitor. The currently supported kinds are
NO_DATA(fires when a topic stops receiving data) andNEW_DATA(fires when a topic receives new data).Alert name - a human-readable label for the alert rule. It is generated automatically from the selected kind and entity, but can be overridden manually.
Domain - the DDS domain to monitor. Only domains currently being monitored are listed.
Host / User / Topic - optional entity filters that narrow the scope of the alert to a specific host, user process, or topic. Each filter can be set from the discovered entities or entered manually using the override toggle.
Threshold - the numeric value that triggers the alert when the metric crosses it. The units shown next to the field depend on the selected alert kind.
Time between alerts (ms) - the minimum interval between two consecutive firings of the same alert rule, in milliseconds.
Timeout (ms) - how long the metric must remain beyond the threshold before the alert fires, in milliseconds.
Script - an optional path to a script executed when the alert fires.
Click Create to add a new alert rule, or Save to update an existing one after selecting it in the Alerts List.
5.3.3.1. NO_DATA
The NO_DATA alert kind monitors the subscription throughput of a topic endpoint and fires
when the data flow drops below a defined rate.
Underlying statistic:
SUBSCRIPTION_THROUGHPUT- the bytes per second received by a subscription endpoint on the monitored topic.Trigger condition: fires when the measured throughput is less than the configured threshold and remains below it for the full timeout period.
Typical use: detect that a publisher has stopped publishing or that a topic has gone silent unexpectedly.
The following fields are active for NO_DATA:
Threshold - the minimum acceptable throughput in bytes/sec. The alert fires when the measured rate falls below this value. The default is
500.0bytes/sec.Timeout (ms) - how long (in milliseconds) the throughput must stay below the threshold before the alert is triggered. Use this to avoid false alarms from brief publish pauses.
Time between alerts (ms) - minimum interval between two consecutive firings of the same rule.
Host / User / Topic - narrow the monitored subscription to a specific entity.
Script - optional script path executed when the alert fires.
5.3.3.2. NEW_DATA
The NEW_DATA alert kind monitors the data sample count received by a topic endpoint and
fires as soon as new data arrives.
Underlying statistic:
DATA_COUNT- the cumulative number of data fragments received by a subscription endpoint on the monitored topic.Trigger condition: fires when a new
DATA_COUNTsample is reported, meaning at least one data fragment has been received since the last check.Typical use: detect the first arrival of data on a topic that is expected to be idle, or confirm that a specific publisher has resumed sending.
The following fields are active for NEW_DATA:
Time between alerts (ms) - minimum interval between two consecutive firings of the same rule. Use a larger value to avoid repeated notifications on a high-frequency topic.
Host / User / Topic - narrow the monitored subscription to a specific entity.
Script - optional script path executed when the alert fires.
The Threshold and Timeout fields are not configurable for NEW_DATA: the alert uses a
fixed greater-than-zero comparison on the sample count, so it triggers on every new data arrival
regardless of the data value.