2. Initialize Monitoring
When Fast DDS Monitor Pro is launched, the following start screen is displayed. Click the Start monitoring! button to begin monitoring a Fast DDS application.
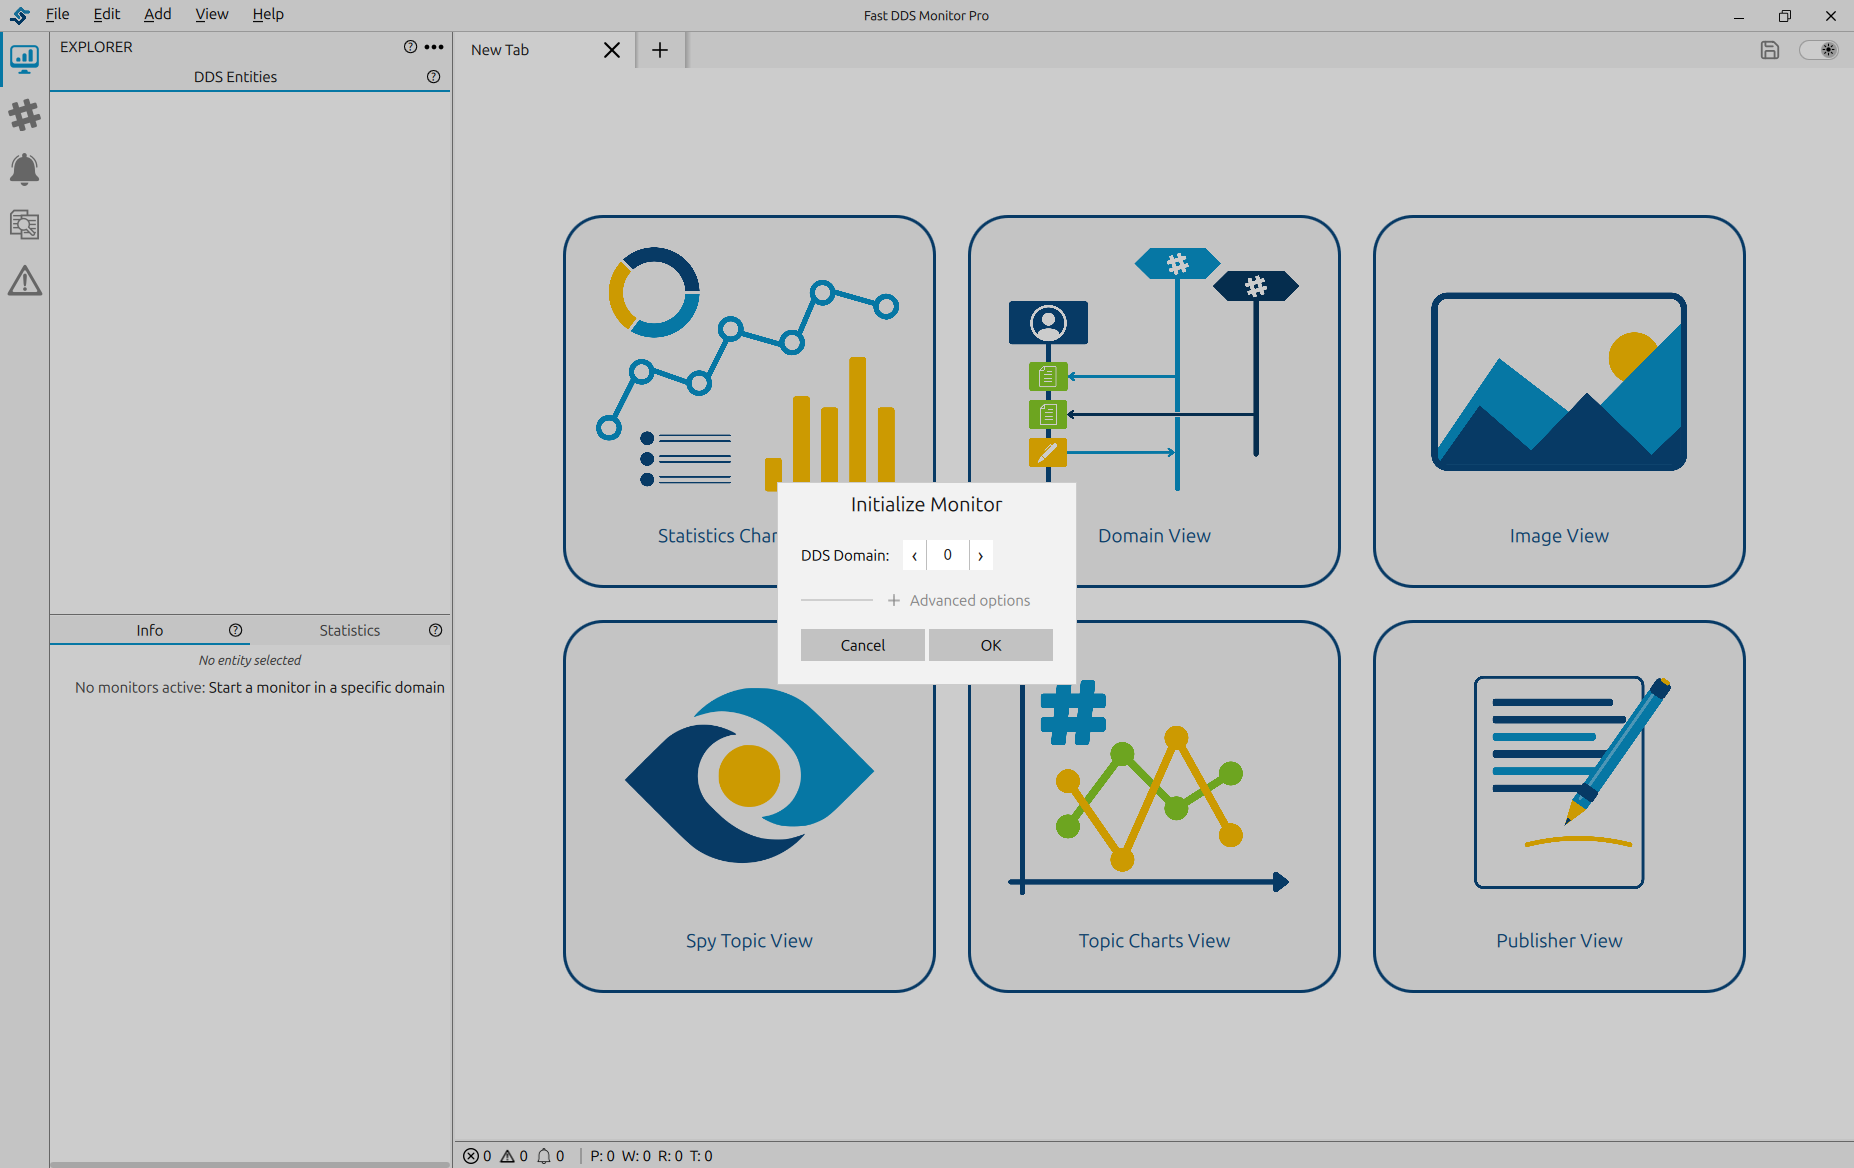
Next, select the type of monitoring to perform, as explained in section Monitor Domain. The screenshot below shows the full monitor interface and the dialog box used to start monitoring a DDS Domain or a Discovery Server network.
Fast DDS Monitor Pro supports multiple active monitors simultaneously. Each monitor operates independently on its own DDS domain or Discovery Server network. See Multiple Monitor Support for details on opening and managing several monitors side by side.
2.1. Dockable Pane Workspace Pro
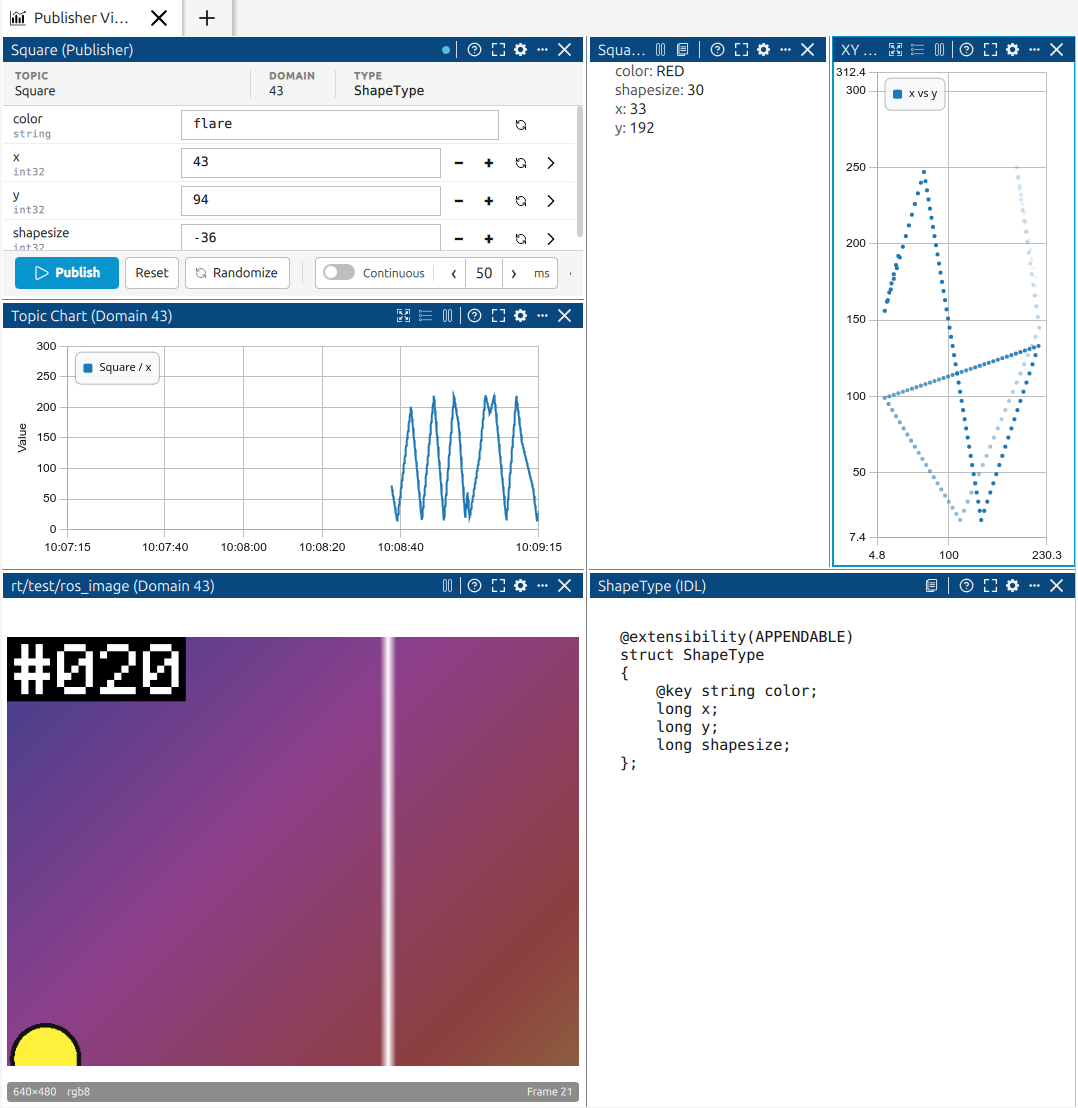
In Fast DDS Monitor Pro, every visualization and inspection view lives in a dockable pane. Statistics charts, topic charts, spy panes, IDL panes, image panes, and publisher panes can all be arranged side by side in a freely configurable split layout. You can resize, split, and close panes at any time to organize the workspace to suit your session.
The main content area of each monitor tab is a grid where each cell holds one pane. A single monitor tab supports up to six panes open at the same time.
To add a pane next to an existing one, click the three-dots button in any pane header, choose Replace panel, Split right or Split down, and select the view type to open. To resize, drag the divider between any two adjacent panes. The layout adjusts automatically whenever a pane is added or closed.
2.2. Dark Mode Pro
Fast DDS Monitor Pro also provides two themes: Light and Dark. When you switch themes, every part of the application updates instantly (panels, charts, dialogs, icons, controls, and the menu bar) without requiring a restart.
To switch themes, open View → Theme and choose Light or Dark. Both entries are mutually exclusive checkable actions; the active theme shows a checkmark.
The selected theme is persisted in the workspace file and restored when the workspace is loaded. If no workspace has been saved yet, the application follows the operating system color scheme: it starts in Dark mode on systems that report a dark scheme, and in Light mode otherwise.
The theme is applied across all components:
Panels and sidebars - backgrounds, text, row hover states, scrollbars, and dividers.
Charts - backgrounds, axis labels, grid lines, and legend text. Chart series colors are a fixed ten-color palette that is the same in both themes.
Domain graph - node and edge colors adapt; entity status colors (green/yellow/red) are fixed.
Dialogs - all dialogs, wizards, and alert/alias forms use the active palette.
Controls - buttons, inputs, toggles, sliders, and scroll bars are consistently themed.
Icons - automatically switch between dark and light stroke variants.
Title bar and menu bar - the custom title bar and window controls follow the active palette.
2.3. Multiple Monitor Support Pro
Fast DDS Monitor Pro lets you run several monitors at the same time within a single workspace. Each monitor connects to its own DDS environment. You can freely switch between monitors, open panes from different monitors simultaneously, or add new ones at any time during a session.
The open-source edition only supports one active monitor at a time; the Pro edition removes that restriction, making it practical for deployments where more than one DDS environment must be observed simultaneously.
When creating a new monitor, choose one of three initialization modes:
DDS Domain - the monitor joins a DDS Domain identified by its domain ID. Every DDS entity in that domain becomes visible in the Explorer panels.
Discovery Server - the monitor connects to a Discovery Server using a locator (address and port). Use this mode when the DDS network relies on the Discovery Server paradigm rather than Simple Discovery.
XML Profile - the monitor reads its configuration from an XML profile file. Useful when the DDS environment requires specific QoS policies or transport settings defined outside the application.
See Initialize Monitoring for the full initialization procedure and Monitor Domain for further details on each mode.
2.5. Bottom Panels
Three additional panels sit at the bottom of the application window:
Alert Messages Panel - lists the alerts triggered by the application, grouped by alert rule name with timestamps.
Problem Summary - collapsible section at the bottom of the main panel listing detected DDS entity problems such as samples lost or incompatible QoS.
Entity Summary Bar Pro - compact counter strip showing the live total of Participants, DataWriters, DataReaders, and Topics across all active monitors.
2.6. Main Panel Views Pro
The central panel hosts multiple tabs with different views.
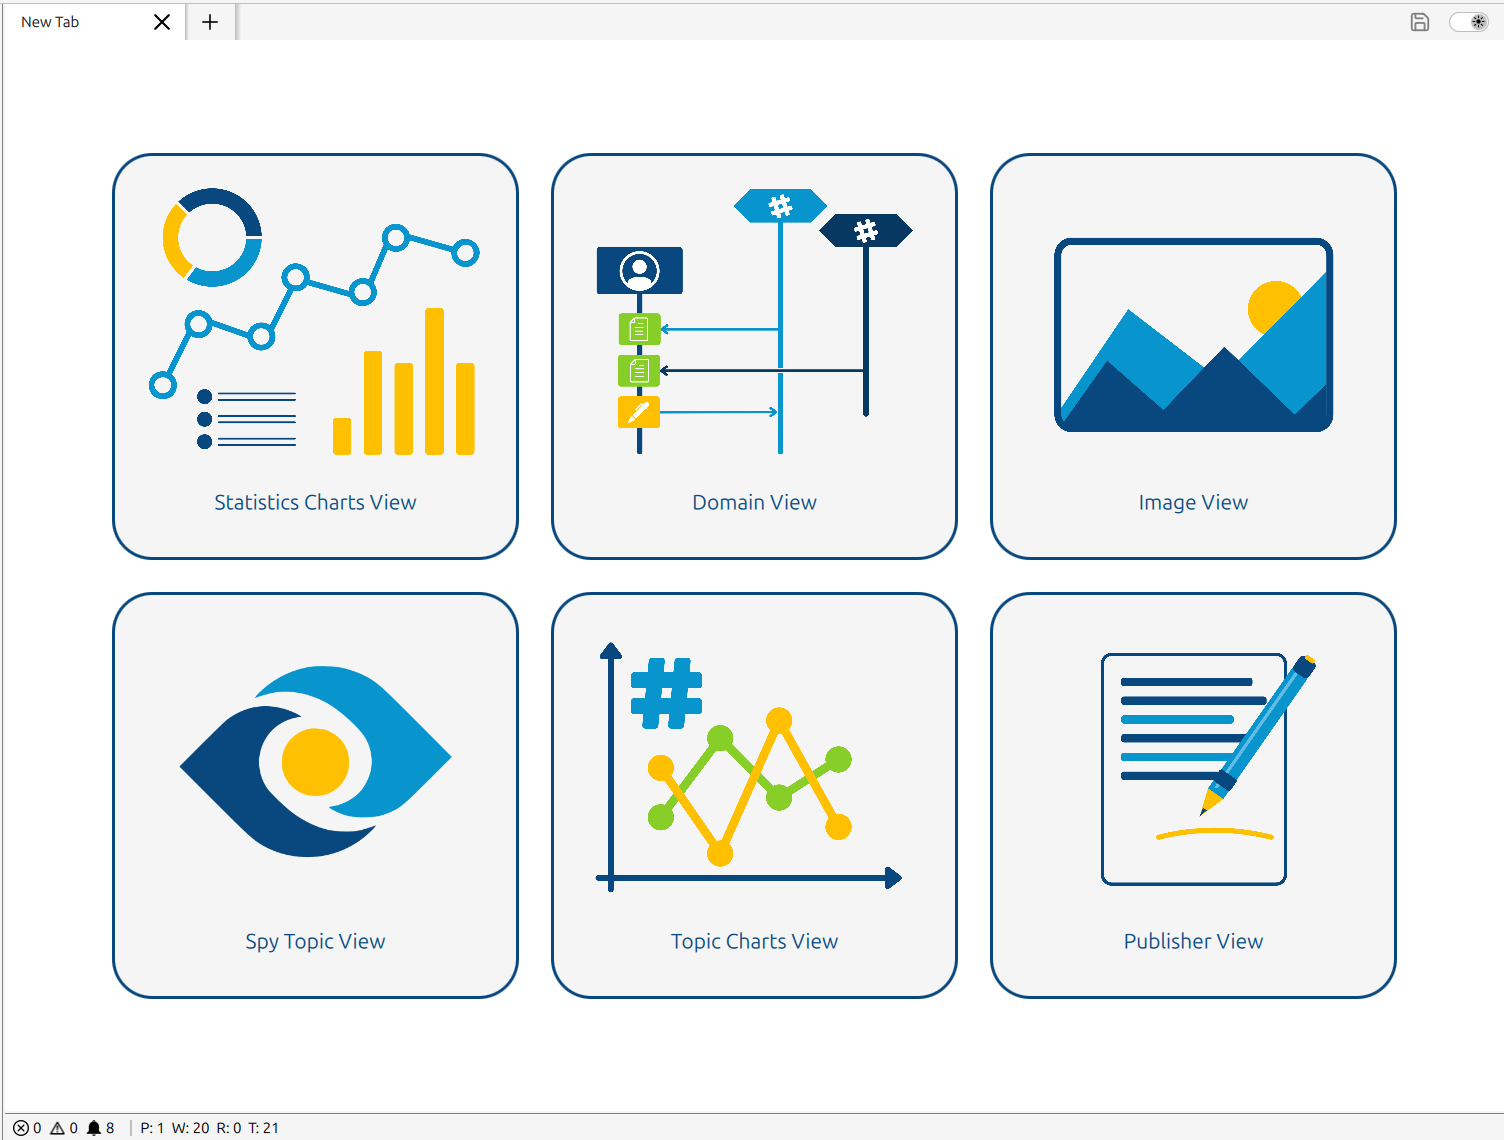
The central panel can display several types of views. Use the Add menu to open any of them in the workspace.
Statistics Charts View - plots pre-computed DDS metrics (latency, throughput, packet counts) over a configurable time range, historical or real-time.
Domain View - interactive graph showing all DDS entities in a domain and the connections between DataWriters and DataReaders through their shared topics.
Image View Pro - renders live image or video data from a DDS topic directly inside the monitor.
Spy Topic View - shows each incoming DDS topic sample as an expandable field tree in real time.
Topic Charts View Pro - plots raw numeric values from any DDS topic against time or other topic field, updated live; supports multiple series and XY scatter mode.
Publisher View Pro - compose and publish DDS samples on any discovered topic using a form generated from the topic’s dynamic type.