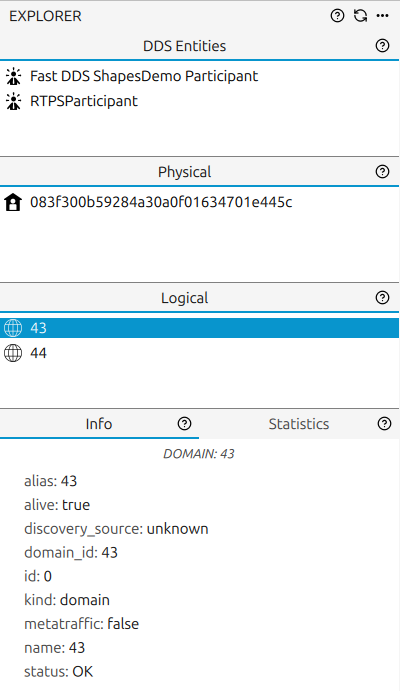
5.1. Explorer Panel
The left sidebar displays all entities known to the application along with their available information. It is recommended to read the Entities section for an overview of the entity types and their relationships before using this panel.
The panel contains a variable number of sub-panels: the DDS Panel,
Physical Panel, Logical Panel, and Entity Info Panel.
Each sub-panel groups entities by category.
Use the ... button in the upper bar of the panel to show or hide individual sub-panels.
The  button in the same bar resets the currently selected entity and rebuilds the entity
models from the current database state; use it if entities appear to be missing or the display
seems out of sync (see also Refresh).
Drag the panel border to resize it.
To hide the entire left sidebar, use View → Hide Left Sidebar.
button in the same bar resets the currently selected entity and rebuilds the entity
models from the current database state; use it if entities appear to be missing or the display
seems out of sync (see also Refresh).
Drag the panel border to resize it.
To hide the entire left sidebar, use View → Hide Left Sidebar.
For more information on entity types and their relationships, see Entities. For more information on entity selection, see Selected Entity.
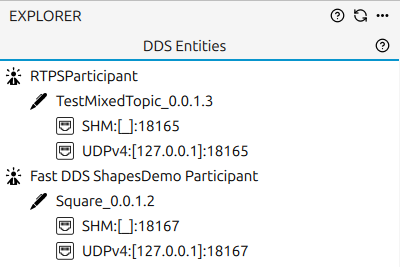
5.1.1. DDS Panel
This panel displays all DDS Entities discovered by the monitor across every DDS domain or Discovery Server being monitored. The list is filtered to show only the DDS entities related to the currently selected entity (see Selected Entity). For example, selecting a specific Host, User, or Process shows only the DDS entities running on that physical context.
Every entity in this panel is interactive:
Double-click the Participant name or icon to expand or collapse its DataWriters and DataReaders.
Double-click a DataReader or DataWriter name or icon to expand or collapse its Locators.
Click an entity to set it as the selected entity. See Selected Entity for details.
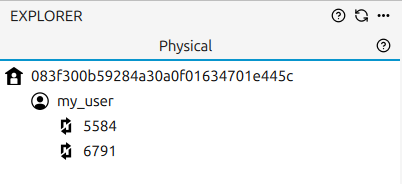
5.1.2. Physical Panel
This panel displays all Physical Entities discovered by the monitor: Host, User, and Process. Every entity is interactive:
Double-click a Host name or icon to expand or collapse its Users.
Double-click a User name or icon to expand or collapse its Processes.
Click an entity to set it as the selected entity. See Selected Entity for details.
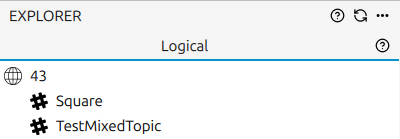
5.1.3. Logical Panel
This panel displays all Logical Entities being monitored: Domain and Topic. Domains are explicitly configured by the user (see Monitor Domain); they cannot be discovered automatically. For example, after enabling monitoring of Domain X, any new DomainParticipant created in that domain along with its DataWriters and their topics - will appear in this panel under Domain X.
Every entity is interactive:
Double-click a Domain name or icon to expand or collapse its Topics.
Click an entity to set it as the selected entity. See Selected Entity for details.
5.1.4. Entity Info Panel
This panel displays information about the currently selected entity (see Selected Entity). It has two tabs:
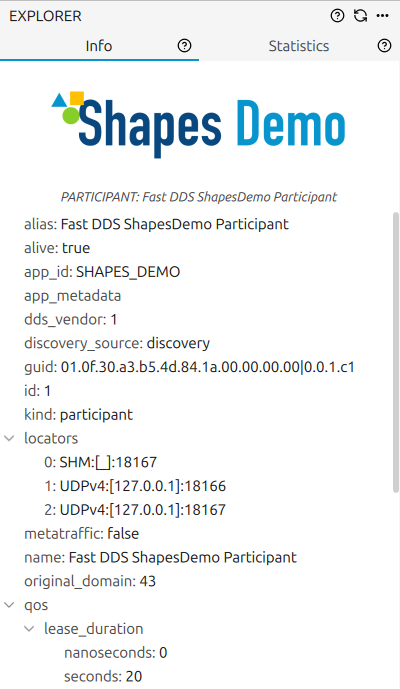
5.1.4.1. Info Panel
Shows the general information of the selected entity. The fields shown depend on the entity type: for example, a DDS Entity shows QoS information, while a Process shows its process ID.
Some fields are common to all entity types; others are specific to each type:
Common fields
alias: user-assigned alias
alive: whether the entity is currently alive
discovery_source: how the entity was discovered (
discoveryfor DDS discovery protocol,proxyfor discovery through statistics messages)id: internal unique identifier
kind: entity type (e.g. host)
metatraffic: whether the entity processes metatraffic data
name: internal name of the entity
status: current status of the entity
Process
pid: process ID on its host
Topic
type_name: name of the topic’s data type
Domain
domain_id: the DDS domain ID
Participant
GUID: DDS GUID
QoS: DDS QoS configuration
DataWriter
GUID: DDS GUID
QoS: DDS QoS configuration
DataReader
GUID: DDS GUID
QoS: DDS QoS configuration
5.1.4.2. Statistics Panel
This panel shows a summary of statistical data for the currently selected entity
(see Selected Entity).
Data is aggregated across all entities related to the selected one, using a single bin spanning
all available data.
When no entity is selected, the summary covers all entities in the application.
The values update automatically every 25 seconds; clicking forces an immediate update.
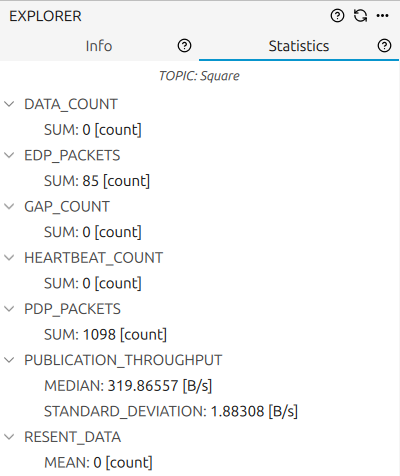
The table below lists every data kind shown in this panel together with the aggregation function applied and a brief description of the metric. Each value is computed over a single time bin that spans all the data collected since monitoring started for the relevant entities.
Data Kind |
Statistic Kind |
Description |
|---|---|---|
|
|
Median application latency |
|
|
Standard deviation of application latency |
|
|
Median publication throughput |
|
|
Standard deviation of publication throughput |
|
|
Median subscription throughput |
|
|
Standard deviation of subscription throughput |
|
|
Mean number of data packets that had to be resent |
|
|
Total number of |
|
|
Total number of |
|
|
Total number of |
|
|
Total number of |
|
|
Total number of |
|
|
Total number of PDP packets sent |
|
|
Total number of EDP packets sent |
5.1.5. Selected Entity
The application tracks one entity as the last entity clicked to determine what information is displayed throughout the interface. An entity is any element that can be tracked by the monitor (see Entities).
To set an entity as selected, click it in any of the Explorer Panel sub-panels. The selected entity is then used as the context for the whole application.
Selecting an entity has the following effects:
The entity is highlighted with a blue background until a different entity is selected or the selection is cleared.
The Info Panel displays the information for that entity, such as its QoS settings or specific entity properties.
The Statistics Panel shows a statistical summary of the data stored for that entity.
If the selected entity is a Physical or Logical entity, the DDS Panel shows only the DDS entities related to it. Clicking a DDS Entities entry in that state does not update the DDS panel. See Entities for details on entity relationships.
To change the selected entity, click a different entity in the Explorer Panel. To clear the selection entirely, use the Refresh button (Refresh).
When no entity is selected:
The DDS Panel lists all DDS entities across every monitored domain, showing all DomainParticipants, DataWriters, and DataReaders regardless of their physical or logical context.
The Entity Info Panel shows a brief summary of the overall application state.